Smart Automated Stress Testing System: Integrating Physical Characteristic Modeling Prediction and AI Visualization Analysis
This project developed a distributed automated stress testing system based on Golang, designed to improve two limitations of traditional testing tools: system wattage control and long-duration test data interpretation.
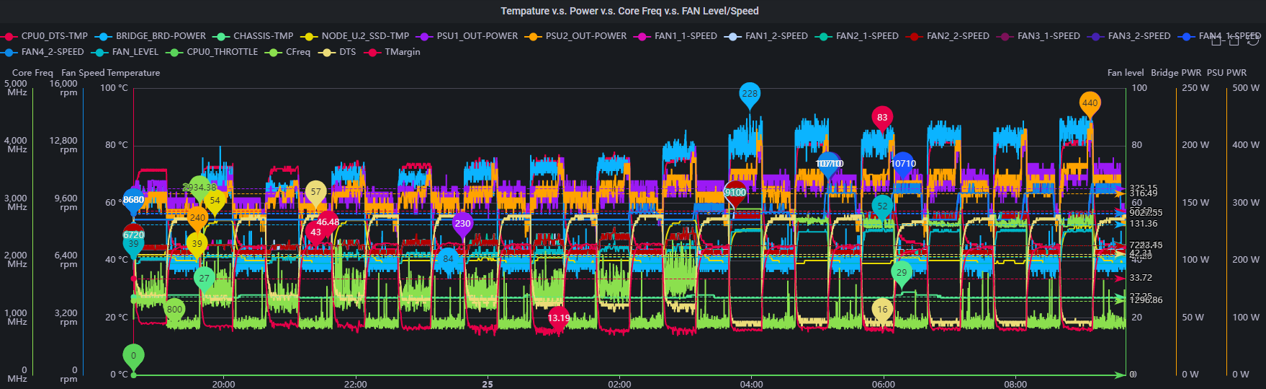
Unlike tools that only execute fixed scripts, this system introduces physical characteristic modeling. It builds mathematical models for CPU (linear growth) and Memory/Ethernet (inverse exponential saturation) components to estimate stress combinations close to a target wattage. For analysis, the system uses Grafana 4D heatmaps to combine temperature, RPM, wattage, and time frequency, then connects to AI visual models to assist chart interpretation and make long-duration test results easier to review.
This project includes two main technical parts:
Physical Characteristic Prediction Modeling: Established interpretable mathematical models for heterogeneous power consumption characteristics of CPU (linear growth) and Memory/Ethernet (inverse exponential saturation) components. Through linear fitting and algorithmic derivation, the system estimates wattage and stress combinations.
AI-Driven 4D Visualization: Designed Grafana 4D heatmaps integrating temperature, RPM, wattage, and time frequency, then connected them to visual AI models to assist chart interpretation and identify potential cooling risks or performance bottlenecks.
🛠️ Technical Case Study
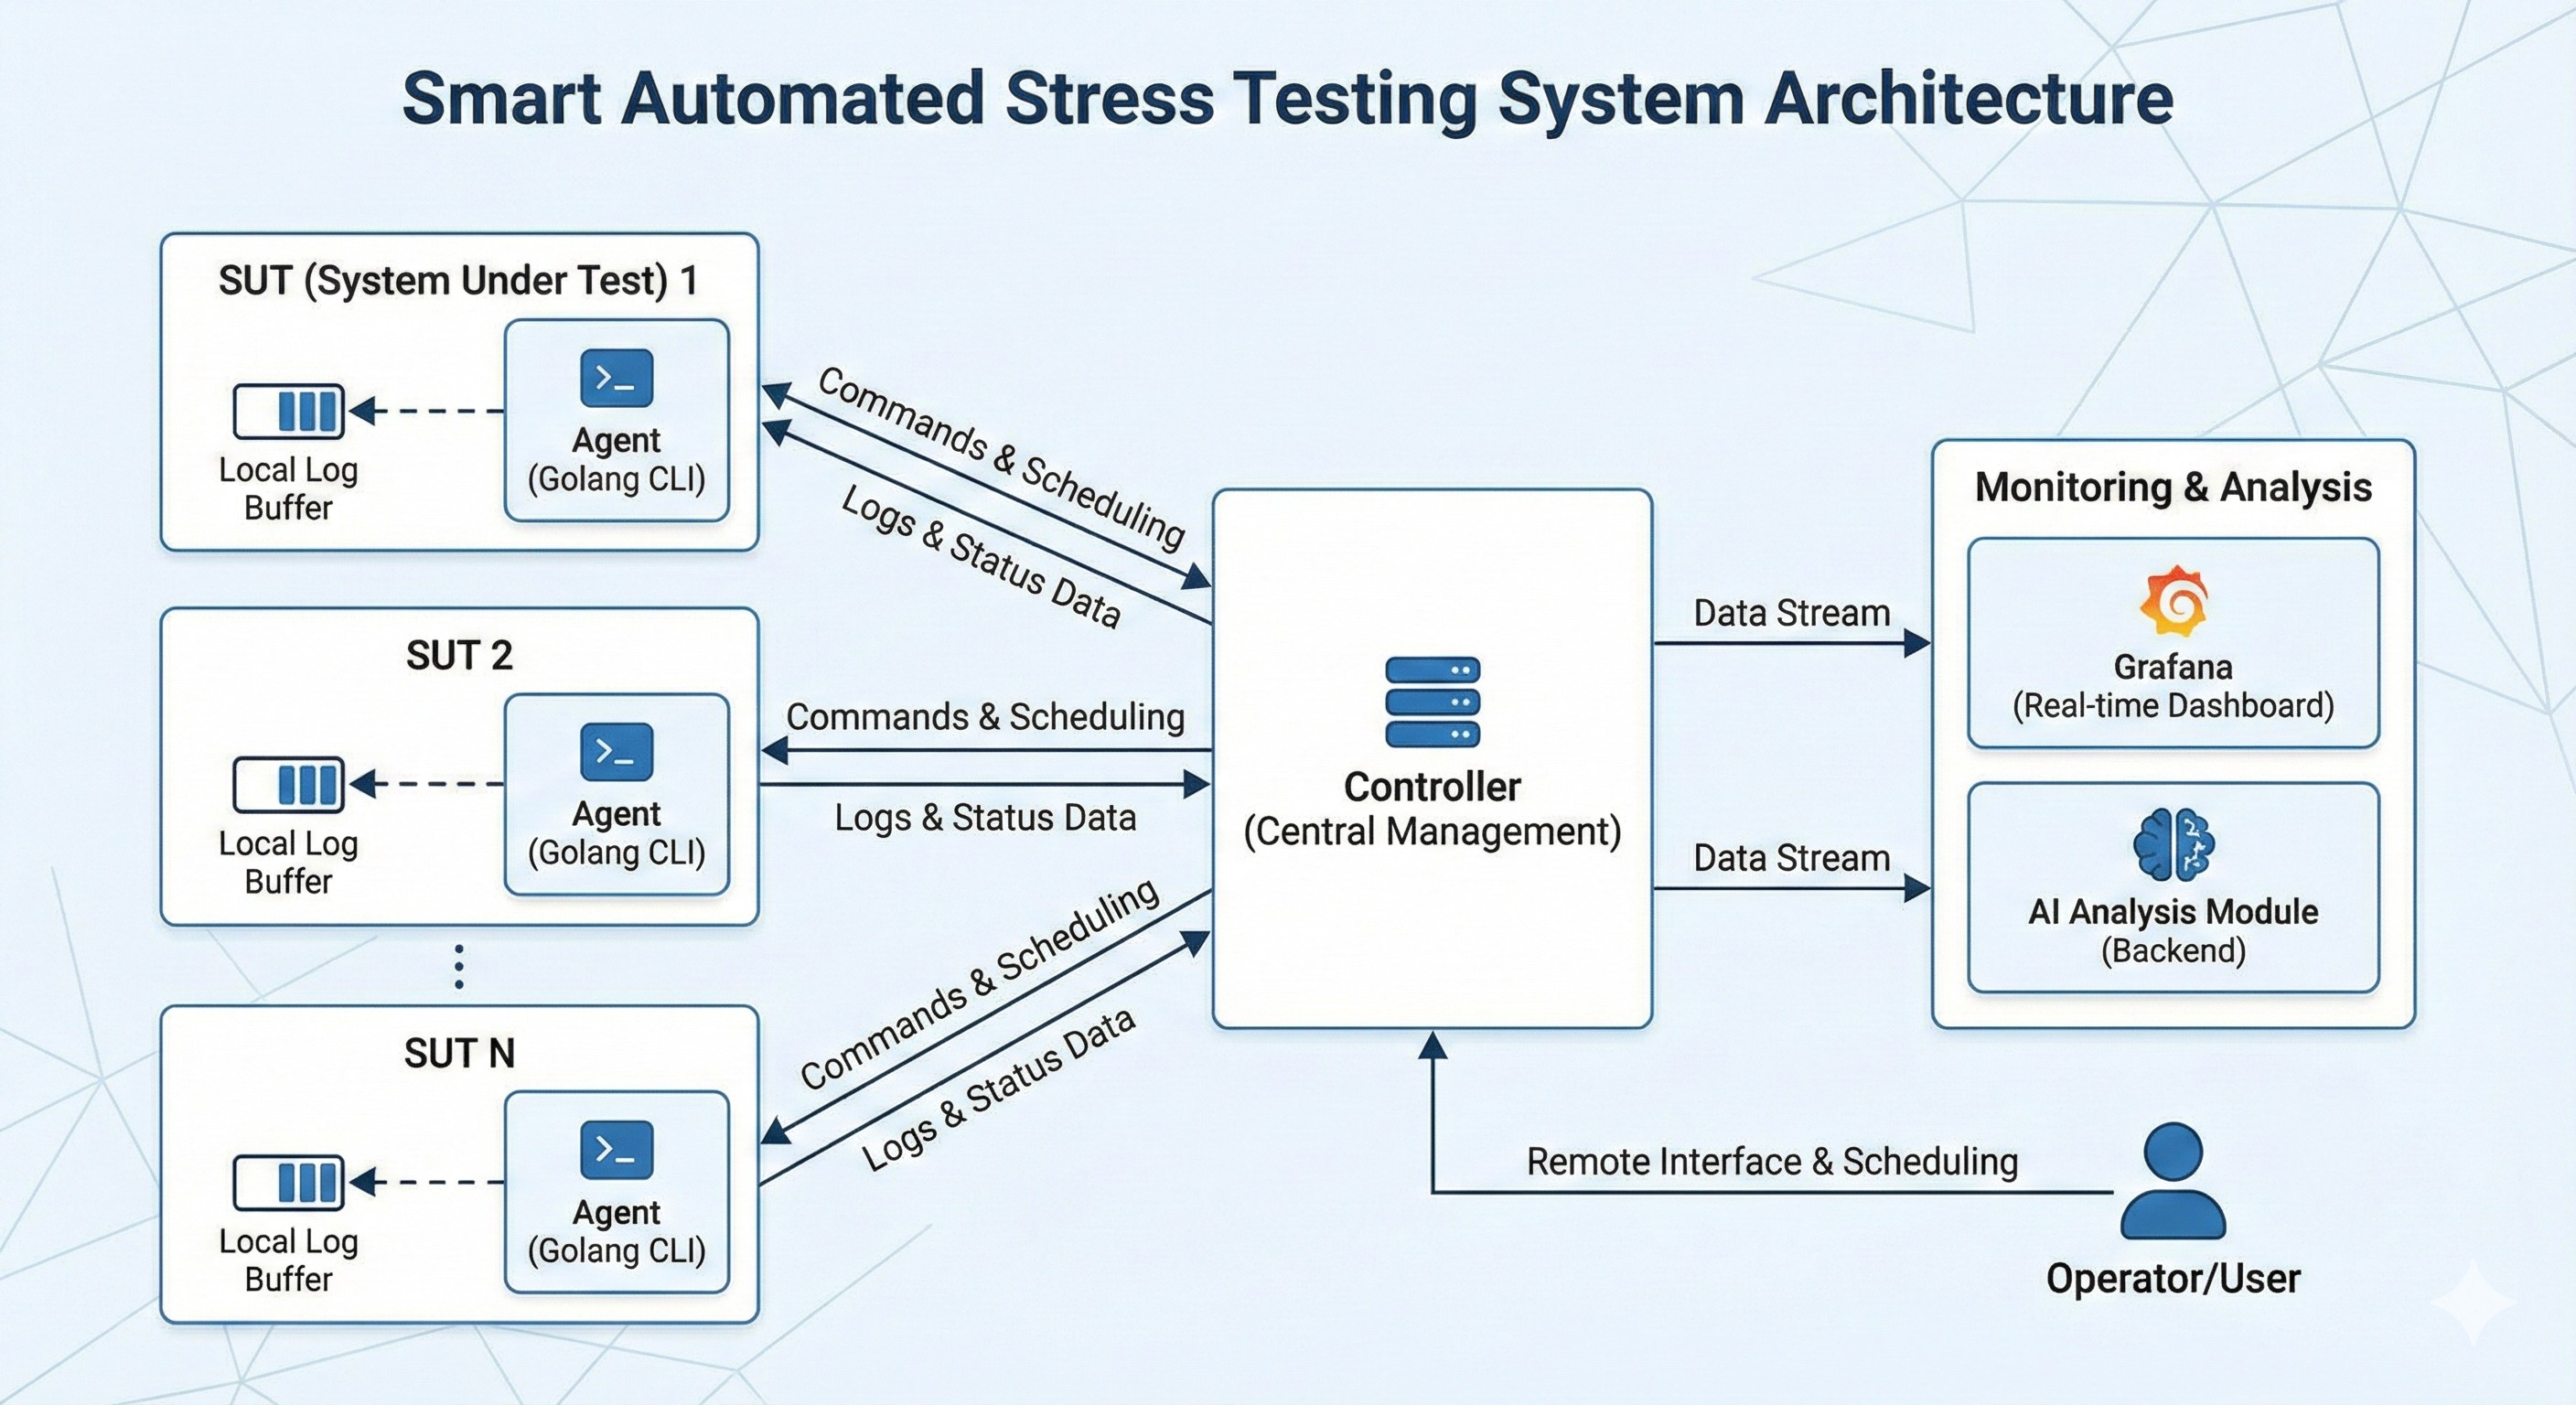
1. System Architecture & Infrastructure
To support multiple devices and long-duration tests, this system adopts a distributed architecture design:
- Agent Side (Golang CLI): Deployed on System Under Test (SUT), responsible for executing underlying test commands. Features local Log buffering mechanism ensuring data integrity even during network interruption.
- Controller Side: Provides one-to-many remote operation interface and reservation scheduling functionality for unattended testing.
- Monitoring & Analysis Side: Integrates Grafana for real-time monitoring and routes data streams to backend AI analysis modules.
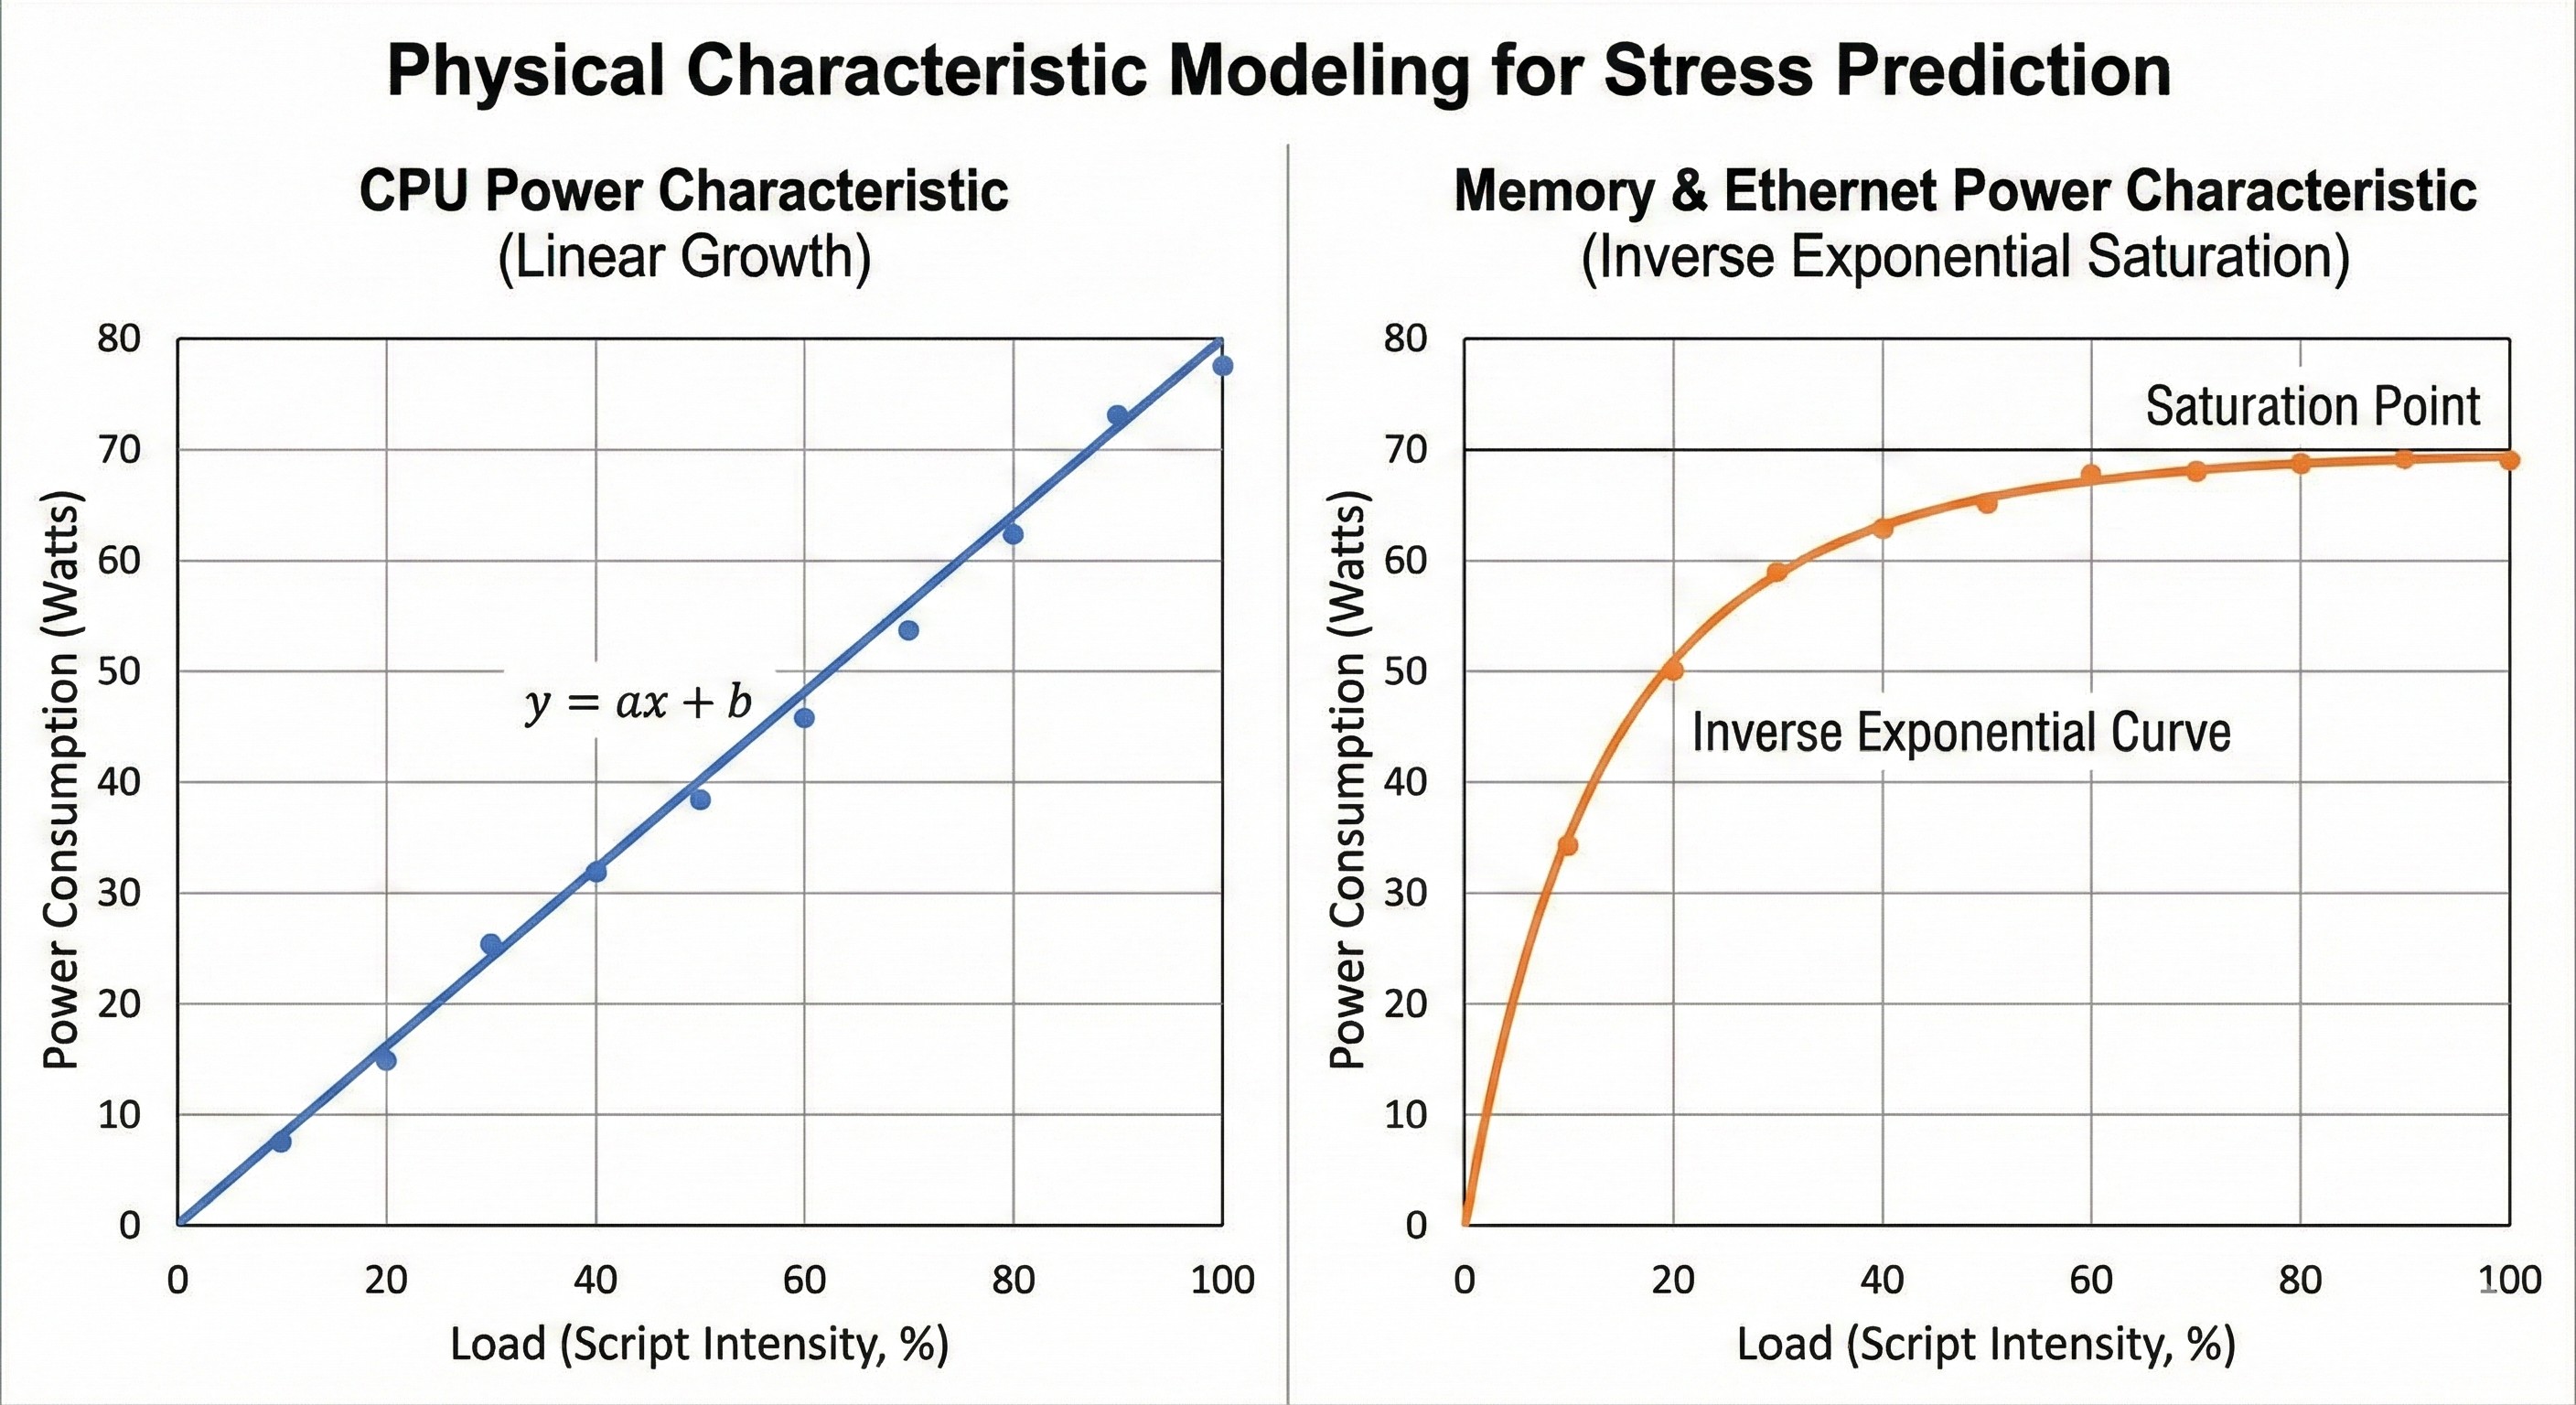
2. Core Technology: Physical Characteristic-Based Stress Prediction Model
This is the main control logic of the system. To bring the system close to specific Thermal Design Power (TDP) boundaries, I reduced trial-and-error script tuning and adopted mathematical modeling.
2.1 Physical Characteristic Discovery
By designing “Pre-test” processes to automatically scan each component’s response from light load to full load, I discovered significant physical differences in power consumption curves across components:
- CPU (Linear Growth): As load increases, wattage shows almost perfect linear rise ($y = ax + b$).
- Memory & Ethernet (Inverse Exponential Saturation): These components show rapid wattage increase during initial load increase, then level off approaching saturation point, exhibiting inverse exponential curve characteristics.
2.2 Mathematical Modeling & Precise Stress Application
Based on these discoveries, I manually derived interpretable mathematical formula models. When users input “target total wattage,” the system calculates through algorithms, considering each component’s weight and saturation characteristics, reverse-solving for optimal CPU, GPU, MEM, and IO script combination intensity.
3. Core Technology: 4D Data Visualization & AI Analysis
After solving the “control” problem, the next challenge is how to “interpret” complex data from long-duration testing.
3.1 4D Grafana Heatmap
To present multi-variable system states on a 2D plane, I custom-designed Grafana panels integrating four dimensions of key information into one chart:
- X-axis: Temperature
- Y-axis: Fan Speed (RPM)
- Color: System Wattage (Power Consumption) - Intuitively shows load level through color intensity
- Point Size: Cumulative Duration/Frequency
Final Test Result Chart
4D Heatmap
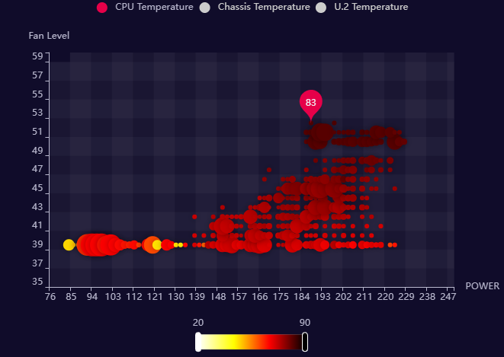
Data Visualization Chart