Portfolio Deck
Portfolio Deck8–10 minute engineering portfolio
01 · Executive Summary
Siri Chiu | Software Automation Engineer
Software Engineer at Advantech building server stress-test, thermal-control, device-observability, and QA tools in Golang/Python; AI assists only behind verifiable rules and human gates.
Primary | Software Automation / Platform Secondary | AI Applications Foundation | DSP / Firmware
02 · Career & Ownership
From signal analysis to engineering workflow and platform automation
My ownership grew from research algorithms and product firmware to software systems spanning equipment and services.
- AdvantechSoftware Engineer
Responsible for Golang/Python automation, server control, IPMI/SNMP integration, Prometheus/Grafana paths, and AI-assisted QA work.
- SentonsDSP / Firmware Engineer
Responsible for MATLAB signal analysis, C# WPF calibration tooling, and C++ firmware work after validation.
- National Cheng Kung UniversityM.S., Biomedical Engineering
Proposed and evaluated an ultrasound imaging method using SVD, background suppression, and structure enhancement.
Target: Software Automation/Platform first, AI application development second; DSP/Firmware supports device and physical-signal boundaries.
03 · Engineering Method
Sense → Model / Contract → Automate → Observe / Verify
Software automation is the main line. AI and DSP support it when a system must interpret unstructured content or physical signals.
- 01Sense
Acquire BMC, SNMP, waveform, issue, and workflow state.
- 02Model / Contract
Define power response, thermal profiles, test truth, and data semantics.
- 03Automate
Execute through controllers, agents, collectors, and pipelines.
- 04Observe / Verify
Retain metrics, logs, assertions, and human gates.
Main line | Software Automation: Adapters → Orchestration → Observability → Gated Action
Support | AI: candidate content and context · DSP/Firmware: signal, device, and product boundaries
04 · Automation Case
Target-Power Stress Testing: One Controller, Multiple Servers
Situation
Fixed burn-in percentages can create high load but do not ensure proximity to a target system wattage; multi-SUT state and long-run logs were also fragmented.
Task / Ownership
I designed the Golang controller/agent flow, pre-test power-response modeling, and telemetry review path. Success meant repeatable scheduling, state collection, and inspectable engineering data.
- Operator
- Go Controller
- Go Agents / SUT
- Telemetry & Logs
- Grafana
Action / Three Engineering Decisions
- Model component responses
Pre-tests showed approximately linear CPU and saturating Memory/Ethernet behavior, so I did not assign every workload the same percentage.
- Buffer logs at each agent
Agents retain execution records across temporary disconnects before returning them to the controller, reducing gaps in long tests.
- Keep AI out of diagnosis
The model proposes chart observations for engineer review; power, thermal, fan, and throttling telemetry remains the review source.
Result / Deliverable
Delivered one-to-many scheduling, state return, target-power workload estimation, and retention of long-duration telemetry.
Evidence / Validation
Reviewed power, temperature, fan, frequency, and throttling time series in the actual Grafana dashboard.
Boundary Public evidence includes no target-power MAE or recovery test, so I do not claim precise target matching.
Case details and disclosure scope↗ (opens in a new tab)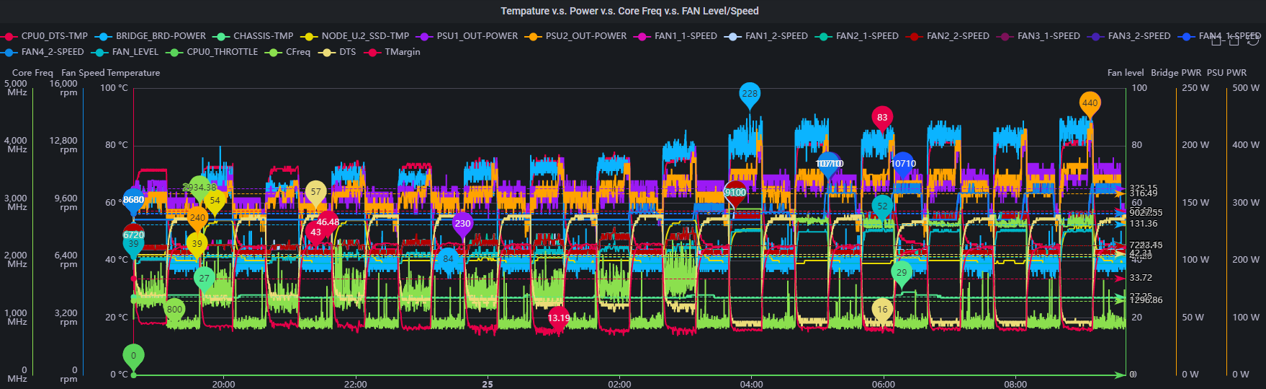
05 · Automation Case
Server Thermal Control: From Weeks of Tuning to an Hours-Scale Workflow
Situation
Open-loop control can over-cool for long periods; repeated trial-and-error PID tuning could take weeks and was difficult to reproduce.
Task / Ownership
I owned the Golang host controller, steady-state profile method, parameter derivation, and non-zero integral reset after load dump. Parameters had to be reproducible and engineering-validated before BMC handoff.
- Environmental Chamber
- Host Controller
- SUT / BMC
- Workload / Fan
Action / Three Engineering Decisions
- Build profiles at equilibrium
I defined steady state as dT/dt ≈ 0, then derived explainable parameters from profile slope and system gain.
- Do not let offline output control the product
Candidate parameters require engineering validation before BMC delivery, preserving the product-control boundary.
- Use a non-zero reset after load dump
I reset the integral term to a dynamically calculated safe base instead of zero to reduce RPM undershoot and oscillation risk.
Result / Deliverable
In the stated internal workflow, reduced a process that could take weeks to hours, established a parameter-handoff procedure, and gained patent-application experience in server thermal control.
Evidence / Validation
The equilibrium detection and data-recording flow is repeatable; engineers still inspect the profile and candidate parameters before delivery.
Boundary Weeks to hours applies to that specific workflow, not a cross-platform benchmark.
Method and safety boundary↗ (opens in a new tab)
06 · Platform Case
Rack Observability: Normalize IPMI/SNMP at the Collector Boundary
Situation
Servers, switches, and PDUs expose different protocols, MIBs, and fields, forcing engineers to inspect separate equipment interfaces.
Task / Ownership
I implemented collection logic from Netgear, Cisco, and Raritan MIBs and normalized BMC/IPMI and SNMP data into Prometheus metrics.
- BMC / IPMI
- Vendor SNMP Adapters
- Collectors
- Prometheus
- Grafana / Alerts
Action / Three Engineering Decisions
- Preserve source semantics
Metrics retain device class and source; similarly named fields from different equipment are not assumed to mean the same thing.
- Separate telemetry from control
Read-only data follows the observability path; PDU power control requires separate authorization and audit.
- Isolate vendor differences in adapters
Adding a vendor changes the boundary collector rather than the dashboard’s core data model.
Result / Deliverable
Delivered one Prometheus/Grafana observability path across server, switch, and PDU classes with threshold-alert support.
Evidence / Validation
Checked each device class and source against the documented collector → Prometheus → Grafana architecture.
Boundary I do not claim an unpublished polling SLA, deployment scale, or universal model compatibility.
Collector implementation and limits↗ (opens in a new tab)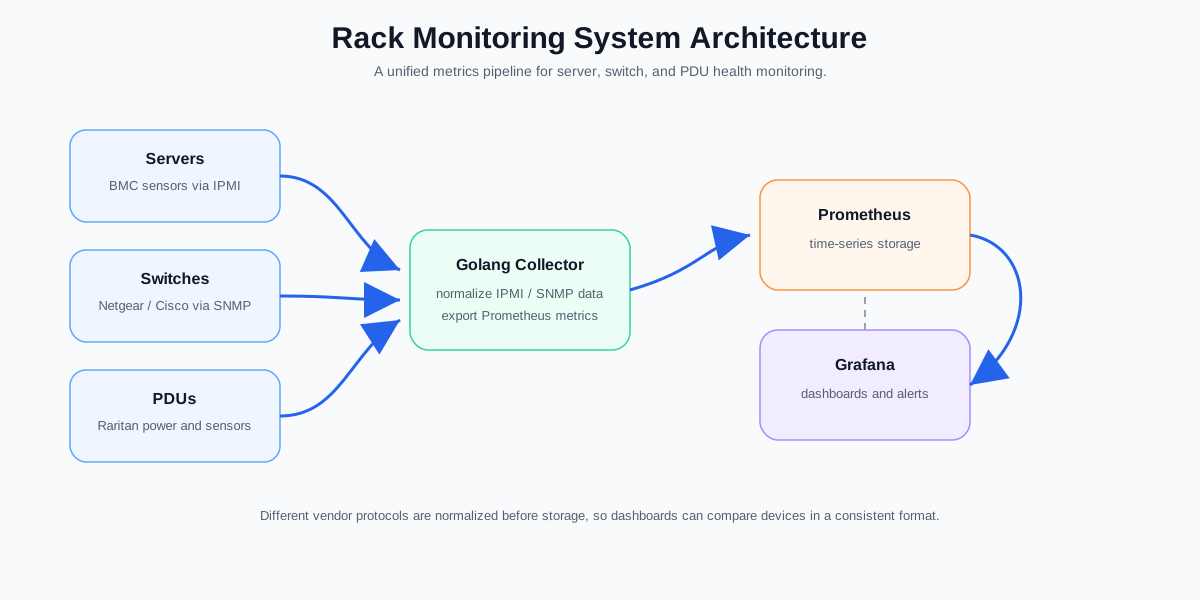
07 · AI Application Case
AI Quality Pilot: Deterministic Rules Own PASS and Write Access
Situation
When an LLM executes, declares PASS, and edits a tracker, plausible language can be mistaken for a validated result.
Task / Ownership
I designed the public system contract and implemented the Python engine, case/evidence pipeline, four-axis truth model, Task/Knowledge Graphs, and issue/Wiki/PR gates.
- Hermes / LLM
- Candidate Content
- Deterministic Engine
- Evidence
- Write Gate / Human
Action / Three Engineering Decisions
- Separate four kinds of truth
workflow_status, test_outcome, gate_status, and health_status evolve independently so one done state cannot conceal failure.
- Validate evidence, not only exit codes
Evidence retains structured assertions, stdout/stderr, duration, contract hashes, and freshness.
- Keep human gates for irreversible action
Commands use allowlists and shell=False; remote issue, Wiki, and PR writes pass deterministic gates.
Result / Deliverable
Delivered an MIT-licensed, repository-agnostic QA toolkit with inspectable state, evidence, local gates, and remote-write request artifacts.
Evidence / Validation
The public repository and architecture are reviewable; its matrix distinguishes Supported, Partial, and Planned capabilities.
Boundary Supported: contracts/evidence/local gates; Partial: MCP and repair handoff; Planned: broader remote integration.
Public architecture and capability matrix↗ (opens in a new tab)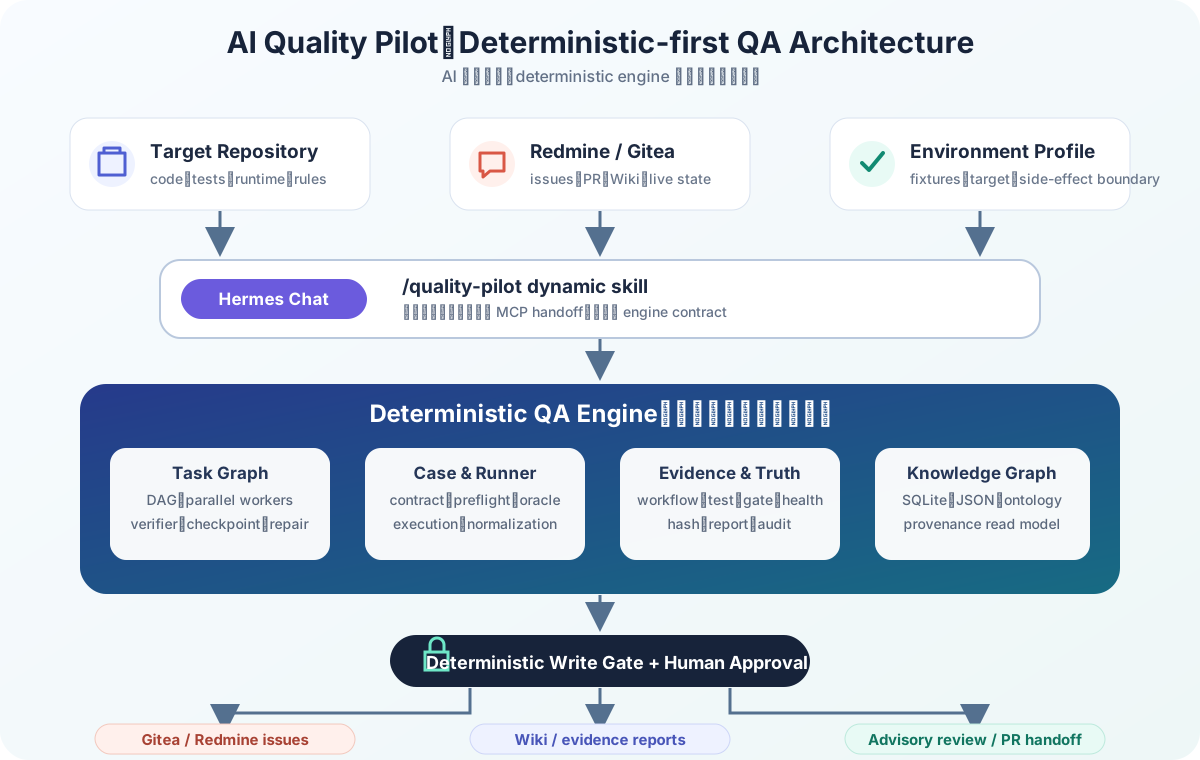
08 · Supporting DSP / Firmware
DSP Productization: From Measured Waveform to C++ Firmware
Situation
Ultrasound-touch parameters change with materials, hardware, and environment; direct config editing hides the relationship among gestures, waveforms, and parameters.
Task / Ownership
I owned MATLAB signal analysis, the C# WPF device/calibration tool, and implementation of validated parameters or requested features in C++ firmware.
- Measured Waveform
- MATLAB Analysis
- C# WPF Calibration
- Engineer Validation
- C++ Firmware
Action / Three Engineering Decisions
- Retain time/frequency context first
MATLAB time/frequency analysis, simulation, and linear/nonlinear filtering avoided reducing a waveform to one value.
- Let the tool propose candidate bands
The WPF GUI combined gesture guidance, device communication, and waveform display so parameters could be reviewed in context.
- Move into firmware only after validation
C++ delivered parameters after the product validation path; I do not claim a one-click optimum across materials.
Result / Deliverable
Established a reviewable signal-to-firmware handoff supporting product validation and production issue work.
Evidence / Validation
Waveform context, candidate parameters, and firmware handoff retained human review; product outcomes were collaborative.
Boundary Customers, product models, yield, and unpublished quantitative results are excluded.
DSP and firmware case↗ (opens in a new tab)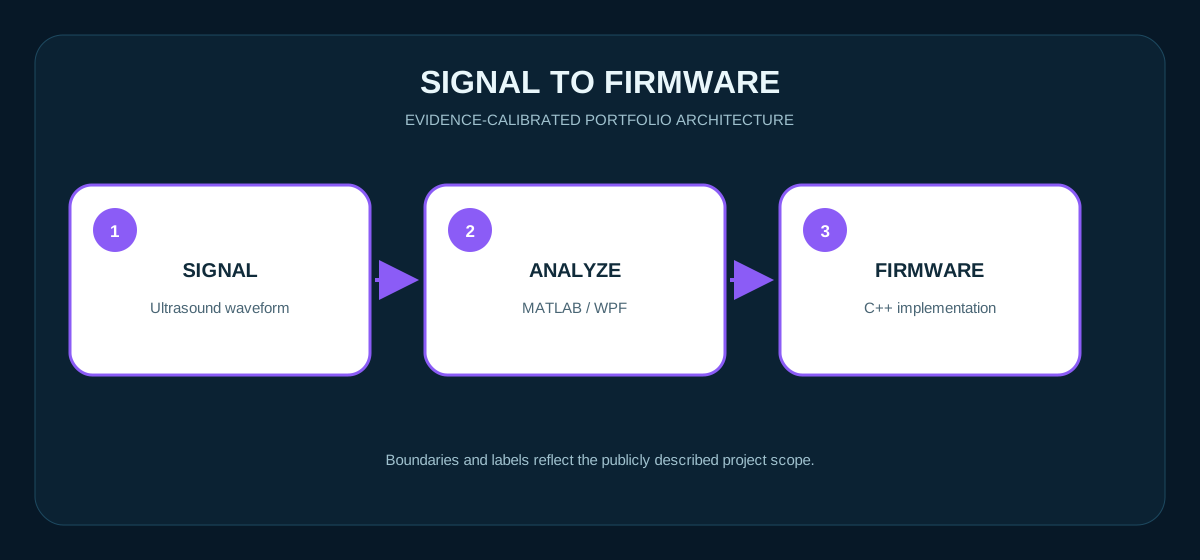
09 · Supporting Products & Research
Additional Products and Research
Lightnews, Redmine, and biomedical imaging demonstrate complete delivery across content workflows, desktop tooling, and research algorithms.
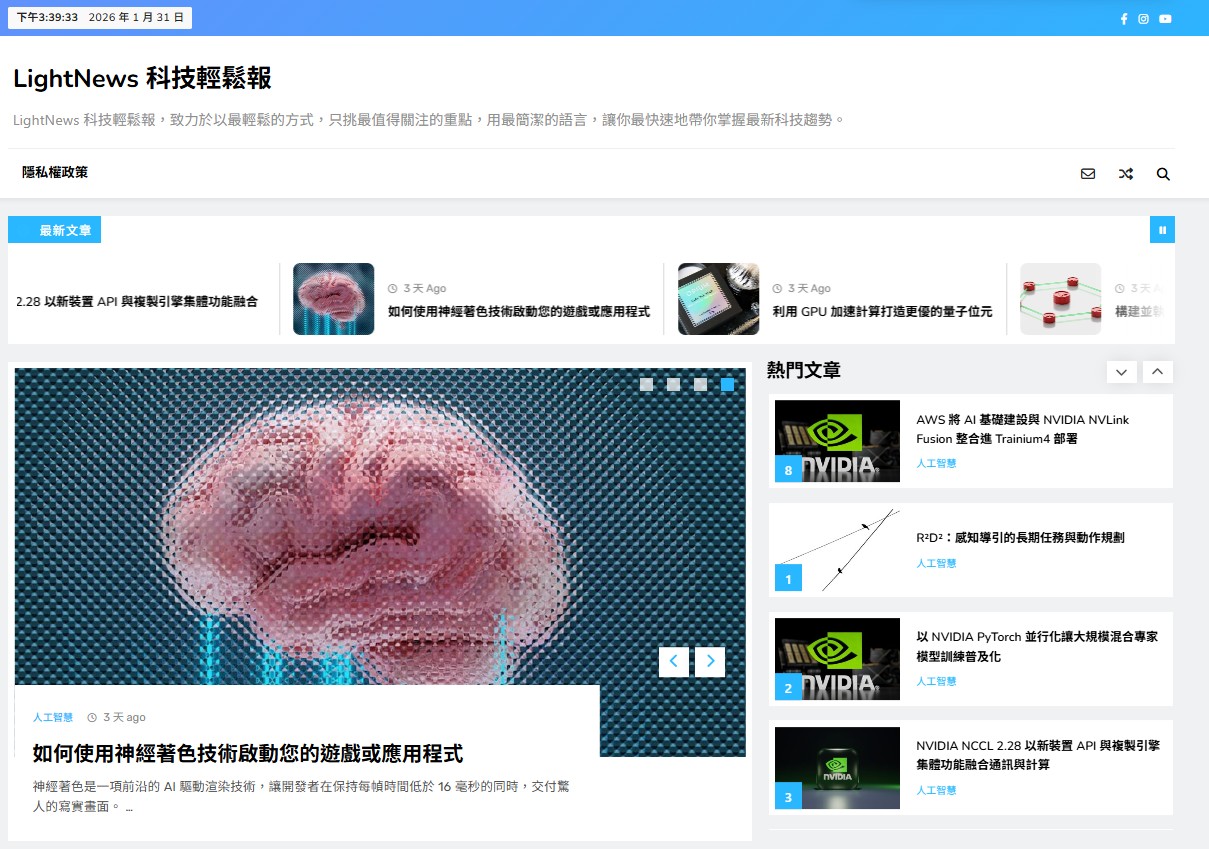 LightnewsContent curation required repeated RSS-to-CMS switching; I connected cleanup, Ollama summarization/translation, and WordPress drafts in n8n, delivering a browsable site and editable draft pipeline.Full STAR+ in A1
↗ (opens in a new tab)
LightnewsContent curation required repeated RSS-to-CMS switching; I connected cleanup, Ollama summarization/translation, and WordPress drafts in n8n, delivering a browsable site and editable draft pipeline.Full STAR+ in A1
↗ (opens in a new tab)
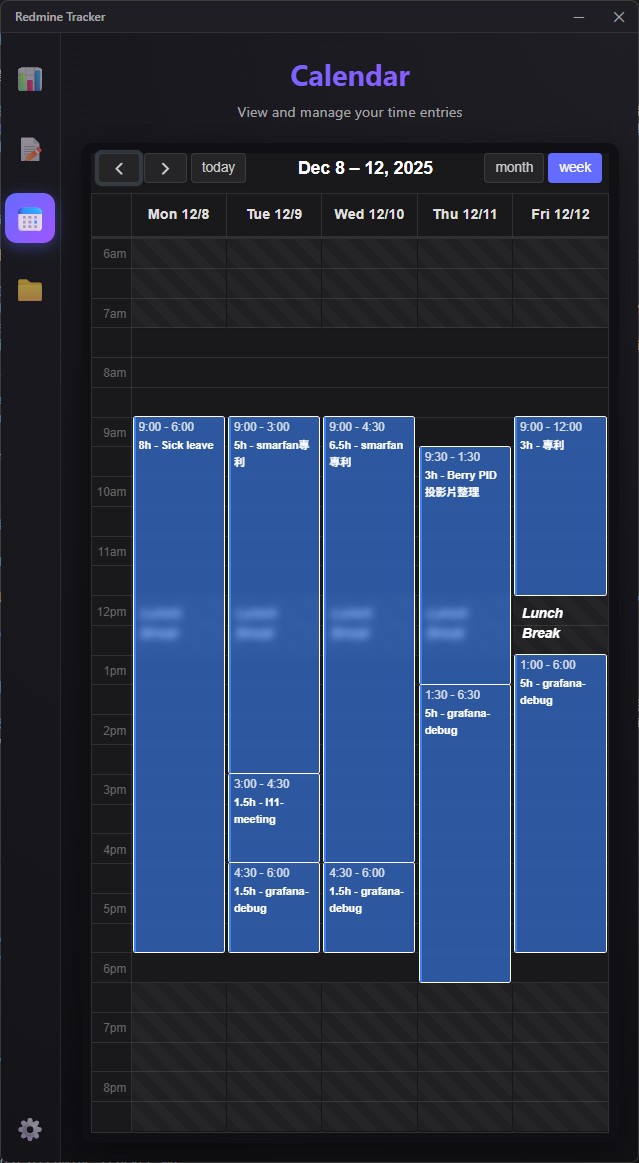 Redmine Smart CompanionReframed scattered time entry as Plan → Track → Review → Log; delivered a React/Electron + FastAPI Windows desktop workflow.Full STAR+ in A2
↗ (opens in a new tab)
Redmine Smart CompanionReframed scattered time entry as Plan → Track → Review → Log; delivered a React/Electron + FastAPI Windows desktop workflow.Full STAR+ in A2
↗ (opens in a new tab)
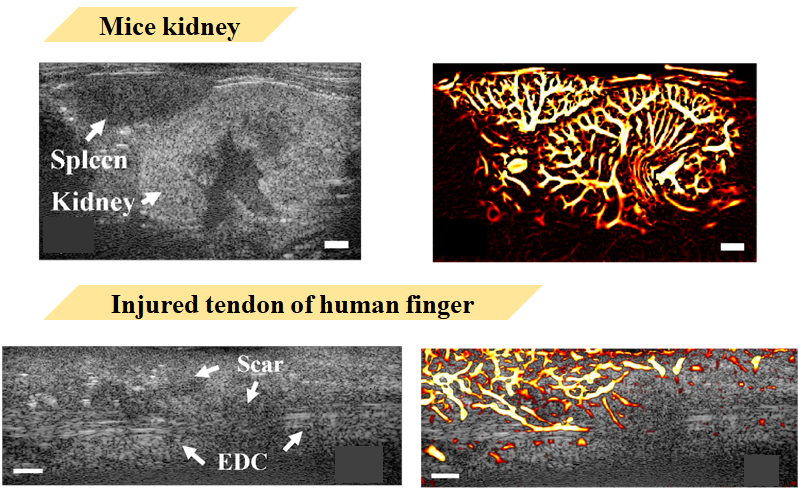 Biomedical ImagingApplied block-wise SVD, background suppression, and structure enhancement to micro-flow imaging; delivered a published method and research results.Full STAR+ in A3
↗ (opens in a new tab)
Biomedical ImagingApplied block-wise SVD, background suppression, and structure enhancement to micro-flow imaging; delivered a published method and research results.Full STAR+ in A3
↗ (opens in a new tab)10 · Skills × Project Evidence
Skill Tree Mapped to Project Evidence
Capabilities are grouped by engineering layer and linked to delivered work.
Stress-test controller/agents; thermal host controller; Redmine local service
Rack collectors; stress telemetry; self-hosted Lightnews workflow
AI Quality Pilot contracts/evidence/gates; reviewable Lightnews drafts
Sentons calibration-to-firmware; high-frequency ultrasound research
11 · Role Fit
Software Automation / Platform | Problems I Can Own
I can own problems where devices, APIs, data, and validation remain fragmented across manual workflows.
- Laboratory or engineering work still depends on manual execution, transcription, and review.
- The team needs device protocols, service APIs, scheduling, and observability connected.
- AI features require truth sources, validation, and safe write boundaries.
Collaboration | Define success conditions and control boundaries with domain experts first, then iterate through small, observable deliveries.
End-to-end ownership | Adapters → Orchestration → Observability → Gated Action
If these are the problems your team is solving, I would like to discuss them further.

A1 · Lightnews STAR+
Lightnews: A Local-LLM Technical Draft Pipeline
Situation
Technical-content curation required repeated switching among RSS, page cleanup, translation, summarization, images, and the CMS.
Task / Ownership
I designed a Linux-hosted workflow that produces consistent, human-reviewable Traditional Chinese drafts.
- RSS
- n8n Extraction
- Ollama
- Image Candidate
- WordPress Draft
- Editor
Action / Three Engineering Decisions
- Use n8n for orchestration
RSS watching, extraction, HTML cleaning, branches, and CMS handoff stay inspectable as separate workflow steps.
- Keep text inference on a managed host
Ollama generates summaries, translations, categories, and image keywords, reducing text sent to third-party LLM APIs.
- Default WordPress output to draft
Editors decide source meaning, translation, image licensing, and publication; the model has no publish authority.
Result / Deliverable
Delivered a browsable Traditional Chinese technology-news site and reviewable draft pipeline.
Evidence / Validation
The public site capture shows articles, categories, and publication presentation.
Boundary Local applies only to text inference; RSS, Unsplash, and WordPress remain external boundaries.
Full case↗ (opens in a new tab)A2 · Redmine STAR+
Redmine Smart Companion: Plan → Track → Review → Log
Situation
In the observed context, one time entry could require roughly ten clicks and page changes, while weekly omissions were hard to inspect.
Task / Ownership
I redesigned Plan → Track → Review → Log and delivered the React/Electron UI, local FastAPI service, and Windows installer.
- React Planner
- Electron
- Local FastAPI
- Redmine API
- Review / Log
Action / Three Engineering Decisions
- Retain the Python backend
This reused existing Redmine automation rather than rewriting all API logic for a desktop UI.
- Separate desktop lifecycle and service
Electron manages UI/process lifecycle; PyInstaller packages the backend so users do not install Python.
- Separate local planning from remote writes
Planning, tracking, and review do not imply that a Redmine record was written; the UI retains the submission boundary.
Result / Deliverable
Delivered a Windows planner/calendar/dashboard and Redmine time-entry workflow.
Evidence / Validation
The actual calendar UI demonstrates planning and review surfaces; public material documents Windows packaging.
Boundary I do not claim macOS/Linux release, fixed productivity gains, or unpublished remote-write test coverage.
Full case↗ (opens in a new tab)A3 · Biomedical Imaging STAR+
HFUDCEI: Micro-Doppler Vascular-Structure Enhancement
Situation
Micro-flow in mouse organs and injured finger tendons required stronger tissue-clutter separation, background suppression, and curvilinear vessel enhancement.
Task / Ownership
I proposed the HFUDCEI imaging algorithm and evaluated it with animal and human research data.
- Ultrafast Ultrasound
- Block-wise SVD
- Background Suppression
- Vesselness
- Research Evaluation
Action / Three Engineering Decisions
- Separate signals with block-wise SVD
Tissue/clutter components were separated from flow information to reduce tissue-motion interference.
- Suppress background before enhancing structure
This avoided having Hessian/Frangi-style multiscale vesselness amplify residual noise.
- Combine comparison and follow-up evaluation
I compared four mouse-kidney cases and examined tendon neovascularity presentation in human follow-up cases.
Result / Deliverable
Delivered and published a micro-Doppler method for vascular-tree visualization and finger-tendon neovascularity research.
Evidence / Validation
Public comparisons and the paper report CNR 20.76 dB and SNR 71.98 dB; ~35 μm refers only to visible vessel-structure diameter.
Boundary The human recovery relationship is preliminary research, not diagnostic or causal proof.
Research case and paper↗ (opens in a new tab)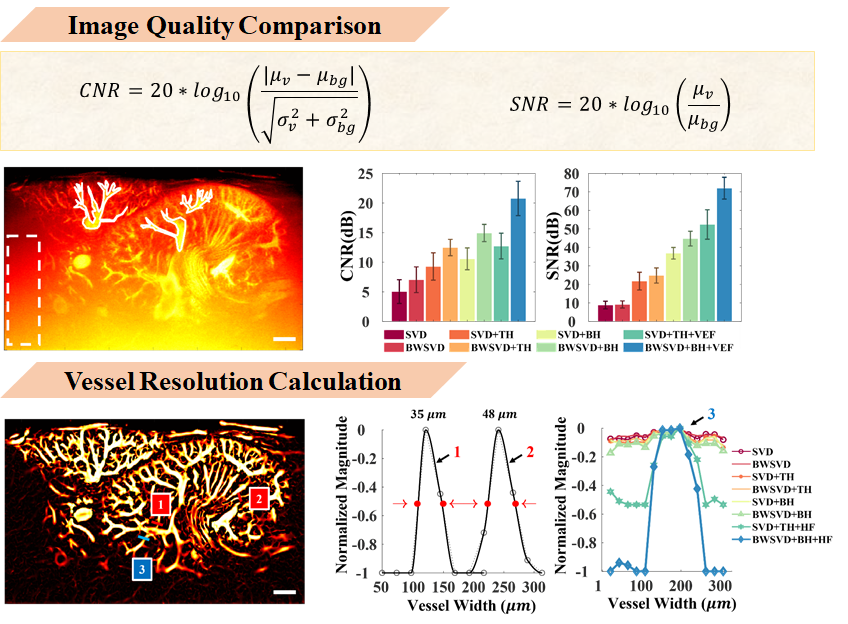
A4 · Broader Project Index
Other Project Index
For Q&A follow-up; links are secondary evidence.
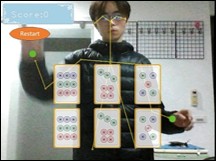 Pose DetectionHuman pose and keypoint detection.
↗ (opens in a new tab)
Pose DetectionHuman pose and keypoint detection.
↗ (opens in a new tab)
 X-ray ClassificationChest X-ray classification experiment.
↗ (opens in a new tab)
X-ray ClassificationChest X-ray classification experiment.
↗ (opens in a new tab)
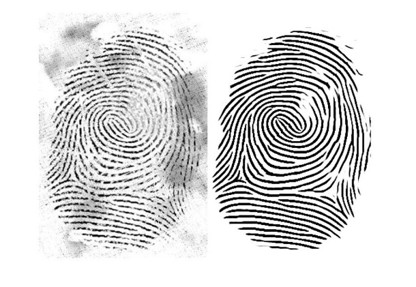 Fingerprint EnhancementImage enhancement for dirty fingerprint regions.
↗ (opens in a new tab)
Fingerprint EnhancementImage enhancement for dirty fingerprint regions.
↗ (opens in a new tab)
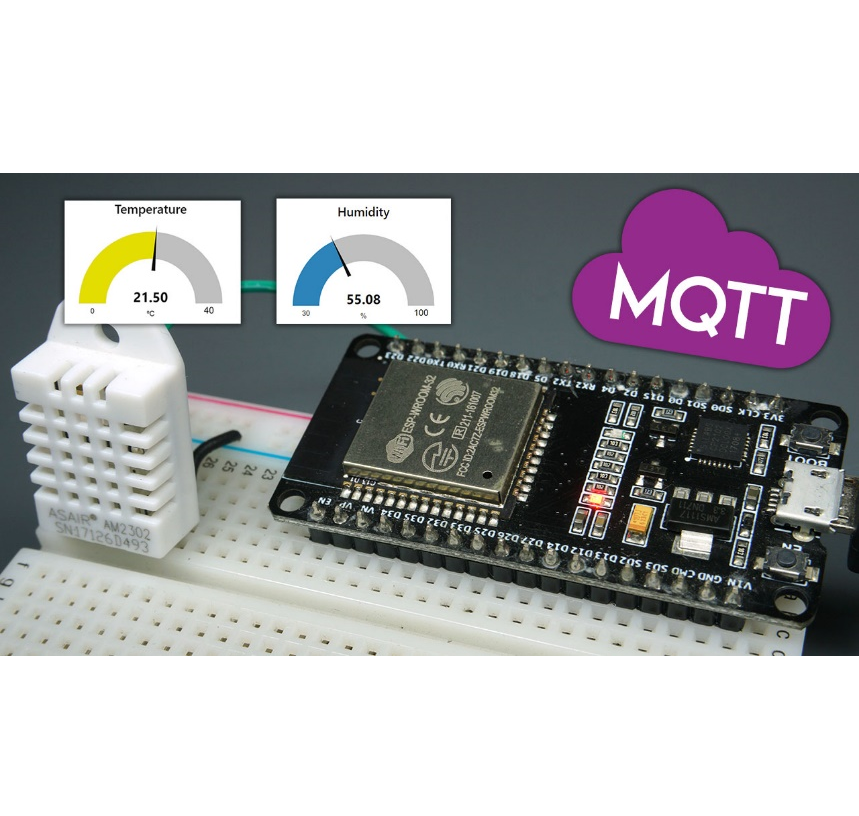 IoT MonitoringTemperature/humidity sensing and live monitoring.
↗ (opens in a new tab)
IoT MonitoringTemperature/humidity sensing and live monitoring.
↗ (opens in a new tab)
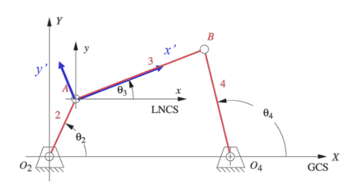 Four-bar LinkageFour-bar linkage simulation.
↗ (opens in a new tab)
Four-bar LinkageFour-bar linkage simulation.
↗ (opens in a new tab)
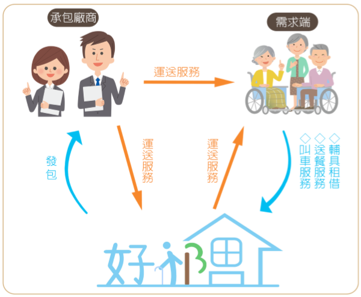 Long-term Care PlatformLong-term care service integration prototype.
↗ (opens in a new tab)
Long-term Care PlatformLong-term care service integration prototype.
↗ (opens in a new tab)A5 · Claim & Disclosure Notes
Claim and Disclosure Boundaries
- Thermal workflow reduced from weeks to hours
- Applies only to the described internal tuning workflow; it is not a cross-platform benchmark.
- AI Quality Pilot close loop
- The public version is a partial close loop; Supported, Partial, and Planned must remain distinct.
- Approximately 35 μm
- Means visibility of an approximately 35 μm-diameter vessel structure in the public research, not generic system resolution.
- Corporate project results
- Exclude customers, product models, hosts, accounts, topology, coefficients, thresholds, raw test data, and legal status.
- Cases without public metrics
- State delivered artifacts and observable capabilities only; do not infer scale, accuracy, savings, or deployment state.