
High-Frequency Ultrafast Ultrasound Micro-Doppler Imaging for Finger Tendon Neovascularity Assessment
I propose a microvascular imaging algorithm that can clearly visualize the vascular tree structure of mouse kidneys and neovascularity information in injured finger tendons, with maximum resolution reaching 35μm diameter.
Abstract
High-frequency ultrafast ultrasound micro-Doppler imaging for estimating finger tendon neovascularity based on curvilinear structure enhancement
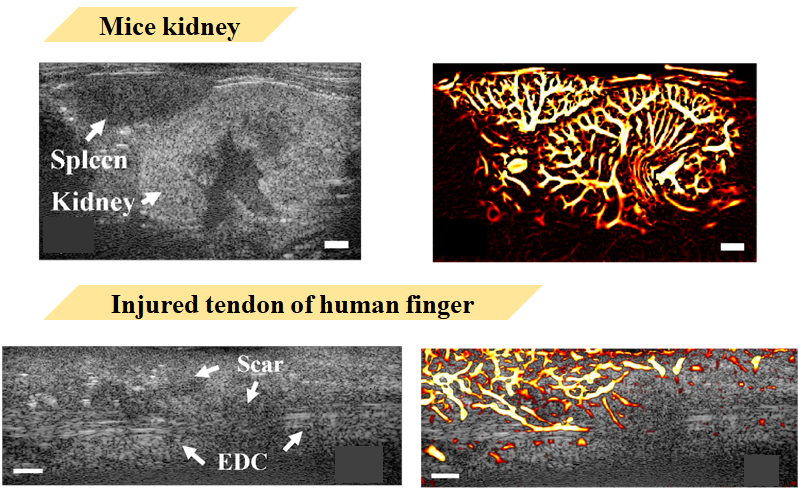
I propose an algorithm that can clearly visualize vascular changes in mouse kidneys and injured finger tendons. The ultrasound images shown here are of mouse kidney and spleen. The kidney is approximately 9mm×5mm in size, and the spleen is approximately 6mm×3mm. These organs have standard vascular tree structures anatomically. It’s impossible to see blood flow changes in organs of this size with clinical instruments. However, through our equipment and my proposed algorithm, blood flow distribution information can be easily visualized.
Research Content
Introduction
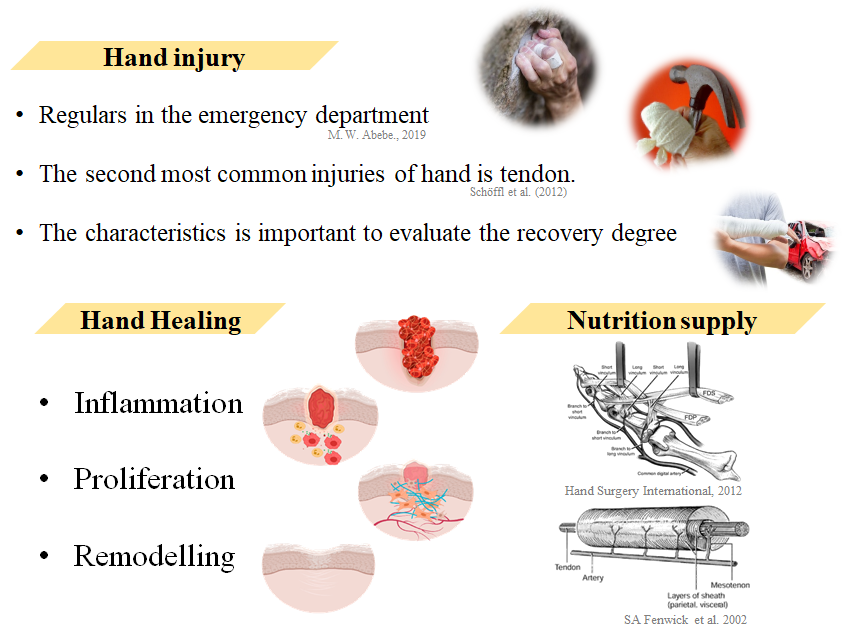
Hand Injury
When any part of the human body is injured, bruising basically occurs. Bruising is a manifestation of neovascularization - the injured site must receive nutrients through blood for repair.
Hand injuries are quite common in emergency rooms, accounting for approximately 10-15%. Changes in characteristics after hand injury are very important for evaluating patient recovery.
The hand repair process is divided into three stages: first the inflammatory phase, then the proliferative phase, and finally the remodeling phase.
Research has shown that neovascularization occurring during the inflammatory and proliferative phases originates from the digital arteries on both sides of the finger. When the finger is injured, both arteries sense the injured site and generate new blood vessels for repair.
Flow Diagram
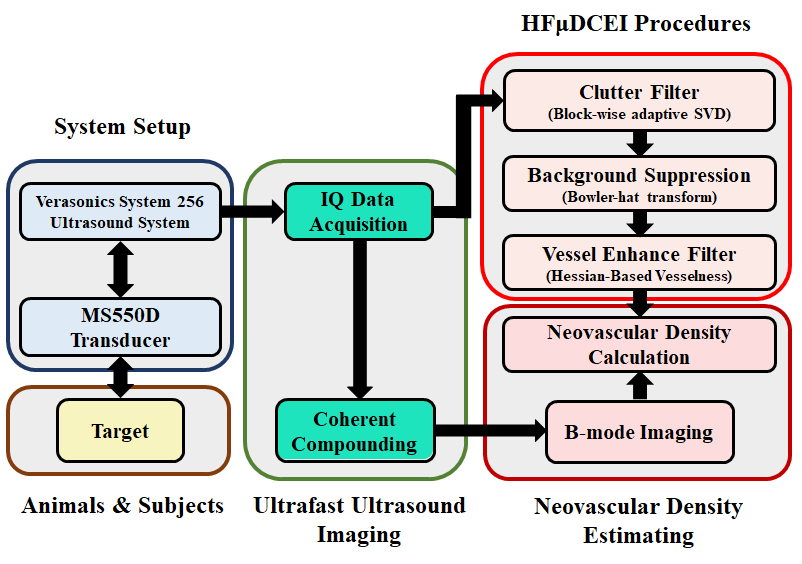
Clutter Filter - (Block-wise SVD)
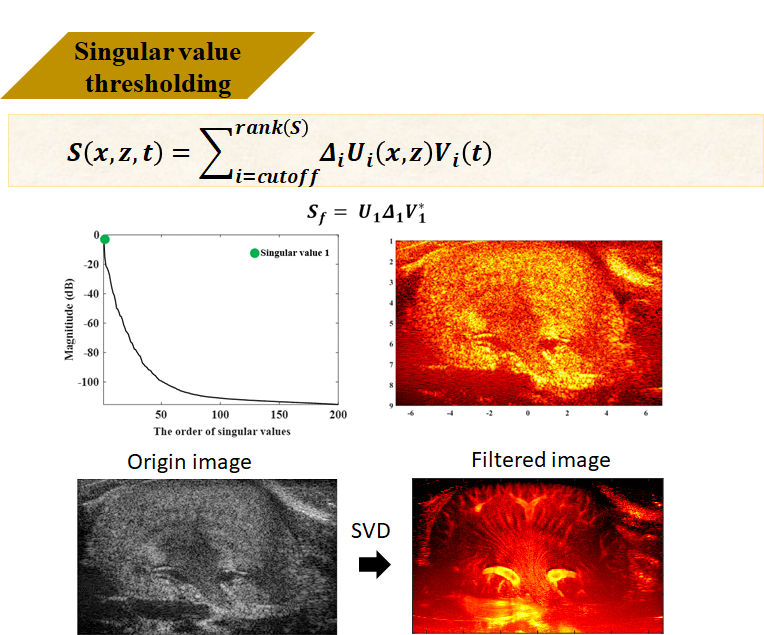
Singular Value Decomposition is a powerful mathematical tool often used for feature extraction. Here I perform SVD decomposition on the entire ultrasound sequence data to obtain three matrices U, Δ, V. U is the left singular vector matrix representing spatial information in ultrasound, V represents temporal information, and Δ represents the weight distribution in the data.
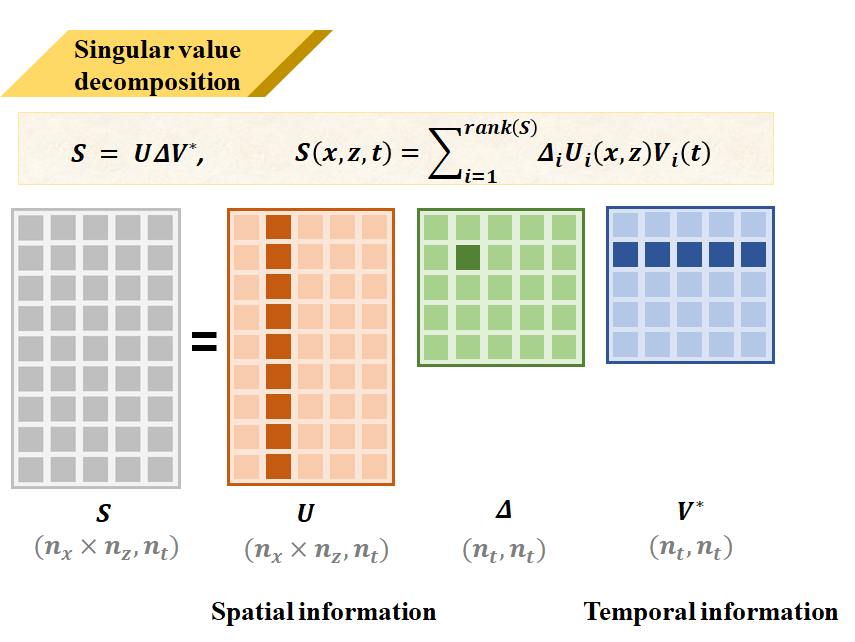
The meaning of each UΔV in ultrasound can be represented by this mouse kidney image. Higher weights can be understood as having the largest spatial contribution and most unchanged temporal information - this is tissue signal. Conversely, it’s noise. By filtering out unwanted tissue signals, the reconstructed result is the filtered data.
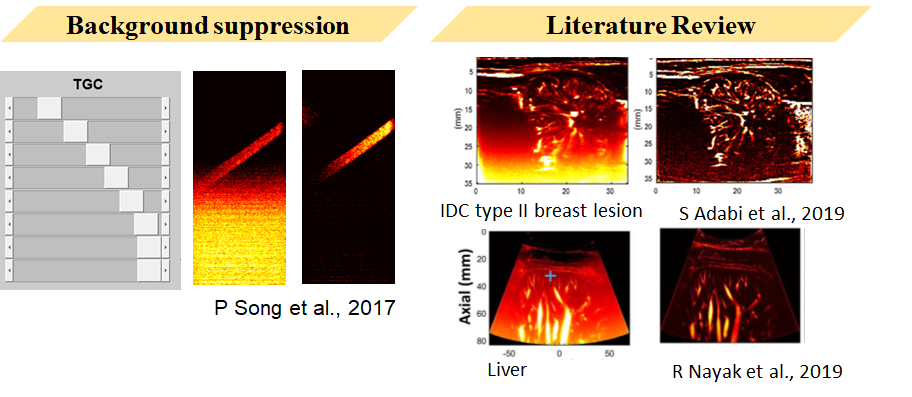
Background Suppression
A gradient background noise layer can be observed in the filtered image.
This background noise was proven by Song et al. in 2017 to be related to ultrasound TGC gain.
In current literature, TopHat transform is commonly used for background removal to obtain clearer vascular images. The upper image shows invasive ductal carcinoma type 2, and the lower image shows human liver.
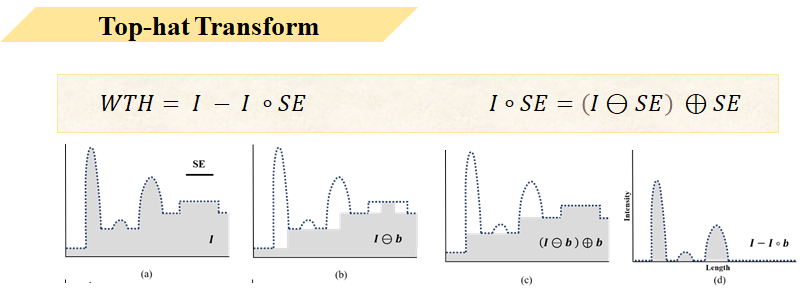
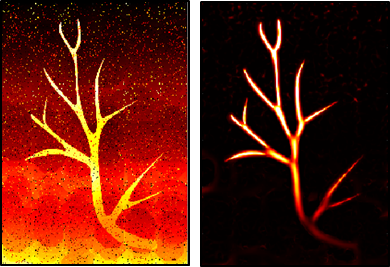
Here I briefly introduce Tophat transform in one dimension. Figure A represents vessel and background noise information before suppression, then through morphological erosion and dilation processing, using this method to extract the background signal. Finally, subtracting the morphologically processed background C from original image A yields image D containing only vessels.
Vessel Enhance Filter (VEF) - Hessian based Vesselness
Even after background suppression, vascular images still appear rough. Here I used the vessel enhancement filter proposed by Frangi et al. and introduced to ultrasound by Bayat to improve vessel visualization.
Vessel feature extraction - this method was originally used in MRA (brain magnetic resonance angiography) and CTA (computed tomography angiography) fields.
In the Vesselness formula, H represents the 2D Hessian matrix of second derivatives - in image processing, this means edge extraction. Hs represents image data at different scales. The two eigenvalues λ1, λ2 of the Hessian matrix are obtained through this formula. λ1 is perpendicular to the vessel feature, λ2 is parallel to the vessel feature. By eliminating features not parallel to vessels, the final vascular image is obtained.
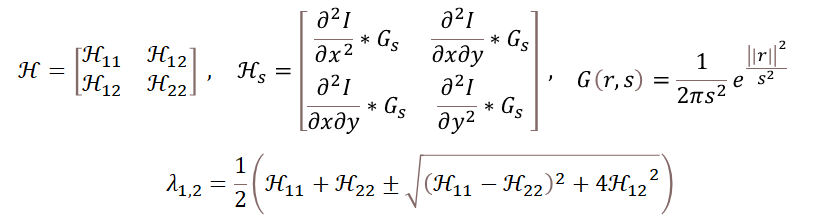
Different λ1 and λ2 represent different structures in the image, for example λ2»λ1 represents curvilinear structures.
Results
Animal Study
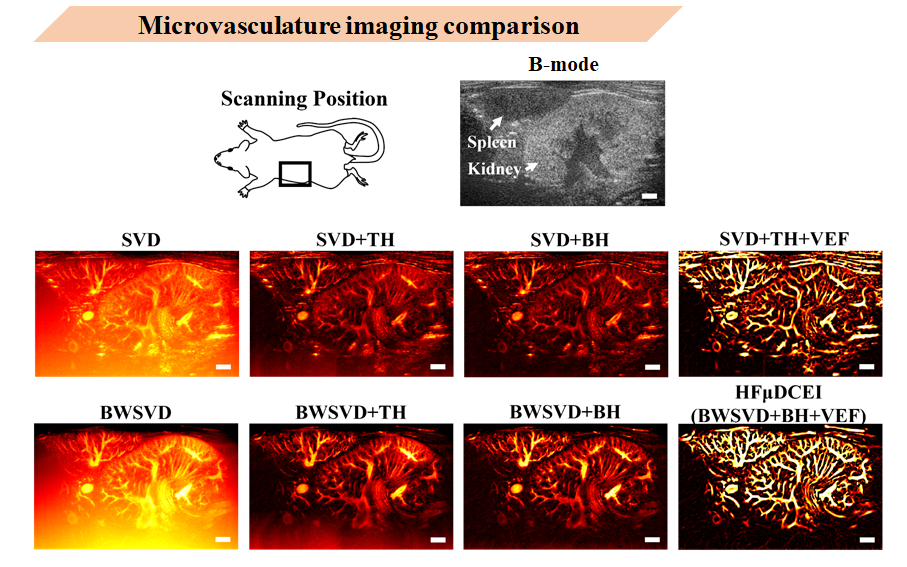
To verify the accuracy and reliability of the HFUDCEI algorithm, I compared images obtained from various vascular imaging techniques using mouse kidney and spleen tree-like vascular structures as reference. I scanned four mouse kidneys in total. This is a photo of one mouse’s left kidney. In the B-MODE image, you can see the kidney and spleen positions. The middle row shows SVD filtering, SVD+TH, SVD+BH, SVD+TH+VEF. The bottom row shows BWSVD, BWSVD+TH background suppression, BWSVD+BH background suppression, and BWSVD+BH+VEF (HFUDCEI).
Directly from the images, before background suppression, a layer of background noise is visible.
In background suppression procedures, compared to TH, BH transform can more effectively filter background signals. If noise filtering is incomplete before proceeding with VEF vessel enhancement, noise may also be enhanced.
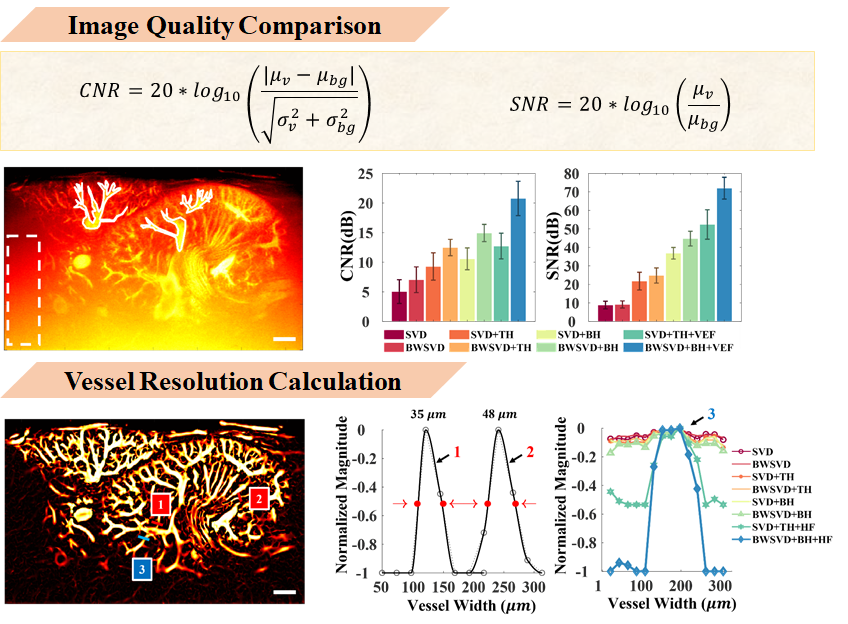
To quantify results from each algorithm, I compared image quality.
My contrast and signal-to-noise ratio were calculated using this formula, with manually selected vascular regions for comparison - white solid lines indicate vessels, dashed lines indicate noise regions. Results were statistically derived from four mice. BWSVD+BH+VEF obtained the highest CNR and SNR at 20.76 and 71.98 dB respectively.
In vessel resolution, vessels 1 and 2 have diameters of approximately 35μm and 48μm respectively. In vessel distribution 3, my proposed algorithm shows the highest peak-to-valley ratio.
In summary, HFUDCEI has excellent sensitivity to vessels and noise resistance, making it a capable tool for neovascularity measurement.
Human Study
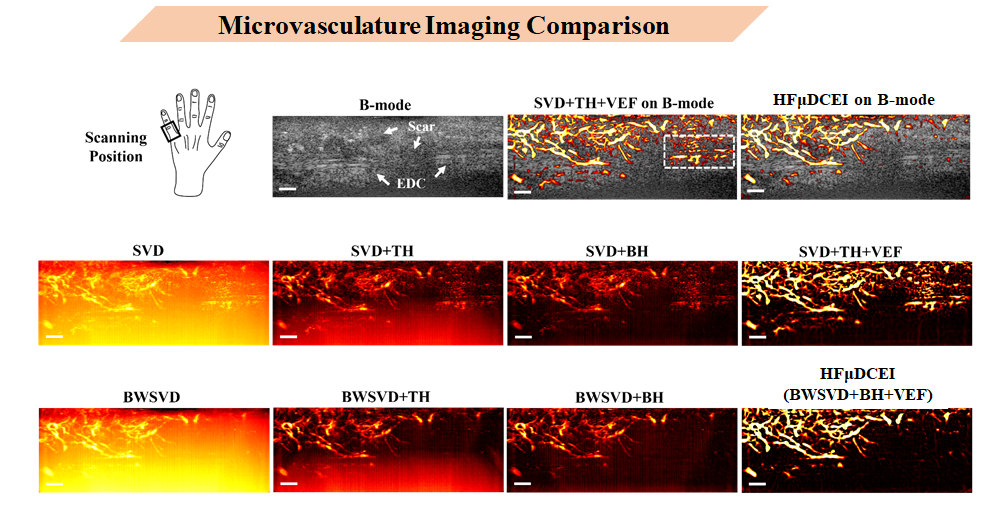
Here are human experiment results. This is a typical EDC tendon rupture case ultrasound image, scanned at the left pinky finger. The B-Mode shows an obvious breakpoint in the EDC tendon with disorganized tissue distribution nearby. Through my algorithm (upper left), neovascularization growing from tissue into the tendon interior can be observed.
Notably, the area outlined by white dashed lines in the second upper-left image was analyzed and found to not actually be blood flow signal, but rather artifacts from incomplete noise filtering and background noise suppression. Such results would cause significant errors in diagnosis and subsequent evaluation - something we don’t want to see.
This is why my algorithm processing steps adopt more rigorous methods for noise filtering.
Subject Evaluation
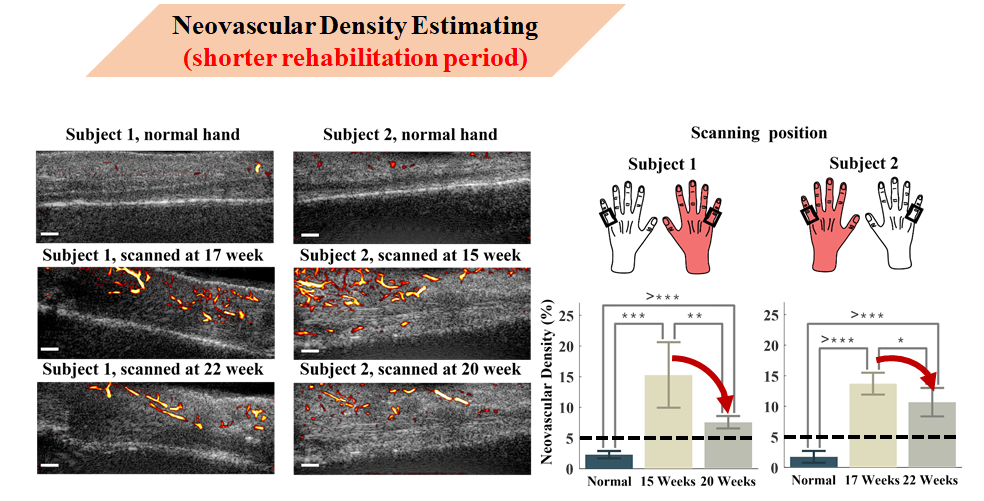
Here I tracked and evaluated two groups of cases. The first group has a shorter rehabilitation period.
The red hand on the right indicates the injured hand, black boxes indicate scanning areas for healthy and injured fingers.
The first row of ultrasound images on the left shows the normal hand. The second and third rows show ultrasound data from one slice in the first and second collections respectively.
Statistical results show that neovascular density in both cases’ injured hands exceeded 5%, and the average neovascular density trend decreased with statistical significance in T-tests (P<0.05). Based on these results, it can be stated that neovascularization from injury is gradually decreasing.
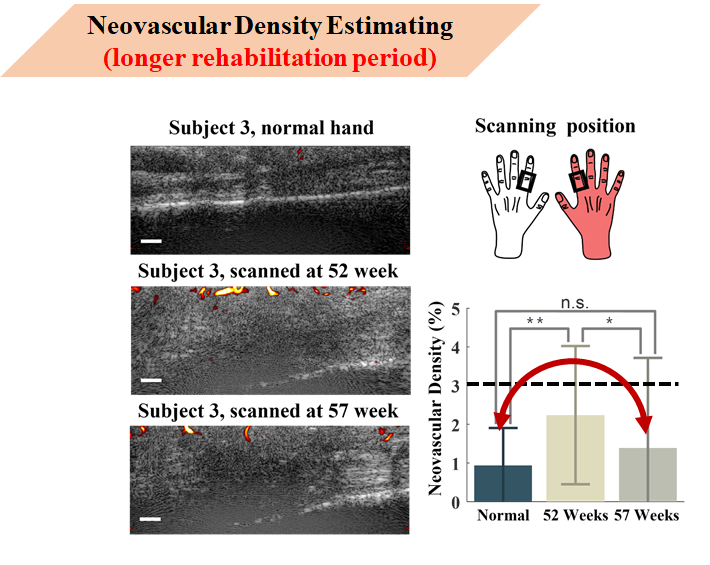
This shows neovascularity density estimation results for a case over one year after injury. The red hand indicates the injured hand, black boxes indicate scanning areas.
Rows 1-3 show the normal hand, first measurement, and second measurement ultrasound images respectively. Case 3’s vascular density was below 3%, with no significant difference between normal hand and week 57 measurement. It can be inferred that after one year of recovery treatment, Case 3’s neovascular density has approached normal levels.
Conclusion
This study proposes a high-frequency ultrafast ultrasound imaging technique based on curvilinear structure enhancement for human finger tendon neovascularity density estimation.
To verify HFUDCEI, I compared different microvascular imaging algorithms on mouse kidney and spleen. Results show my algorithm has superior image quality with CNR of 20.76 dB, SNR of 71.98 dB, and minimum vessel diameter of 35μm.
HFUDCEI statistical results show trends similar to hand injury-related papers.
The correlation between neovascularity and tendon tears has almost no human research, but our results indicate that decreasing neovascularity seems correlated with patient recovery. More specific correlations require more cases to establish.
For more detailed research content, please refer to my Journal paper